I decided to make a risk management case study of the Länsimetro project, which is an extension of an existing metro line from Helsinki to Espoo. I wanted to see if the things I’ve previously written about risk management in software projects (see part I, part II, part III) could also be applied to this particular civil engineering project. I studied how the unfortunate decision of limiting the metro length to just four cars was made, and in the process looked into existing methods of risk analysis to learn what kind of tool would help decision makers in charge of projects to make better decisions in the future.
Decision about automation
Most interesting part about the whole project for me was the decision to build a fully automated metro. The decision to automate the old Helsinki Metro was made in 2006. Automation was to be done by upgrading old metro control system, which would enable the old metro line to be operated fully automatically, without drivers.
According to Otso Kivekäs, no risk assessment about the automation project was made. Eventually, this automation project was well underway when the extension line construction to Espoo was started in 2009. It’s easy to see how the upcoming automation project was automatically applied to the new metro line because work was already underway in the old section. The decision for automation seems to have been taken as granted when designing Länsimetro, and this decision had profound effects on the Länsimetro design, which were irreversible.
Long story short, the decision to postpone the automation project for the whole metro, old and new lines, was eventually done in 2014 after running into trouble with supplier, technology and cost overruns. However, the automated metro and everything that was thought to be possible with it was already applied as a given design constraint in Länsimetro design.
Automation decision as a constraint on new metro line design
Because of the planned automated metro, the new metro line was designed to be operated with shorter train intervals (90-100 seconds) that was previously possible using human drivers (240 seconds). And because of shorter intervals, the metro was designed to be operated with shorter trains using only four cars (train length of 90 meters compared to old length of 135 metres). The logic here was that the same amount of people could be carried using shorter trains operated with shorter intervals, as with longer trains and longer intervals.
The decision to use four car trains was then applied as a design principle when building new metro tunnels and metro platforms. Space on the platform was only allotted for these shorter trains.
It has turned out that extending the metro platforms is not possible anymore, because of design decision(s) done on Otaniemi station, where the tunnel makes a steep, almost U-turn. The tunnel would need to be straight on the whole extended platform in order to make the extension possible. Another, even more major design decision was made with placement of fire doors and smoke ventilation shafts, which are allegedly too difficult to move afterwards.
Here we can see how a one engineering project (automation) had a profound effect on the design of another, bigger project (Länsimetro). When the automation project failed, the damage was already done. HSL projections now show, that Länsimetro runs the risk of becoming capacity constrained in 2020s. That is hardly a desirable outcome for a brand new infrastructure project like this.
Some requirements for general approach to project risk management
I started to think how the decisions made along planning and building phase of Länsimetro had a profound effect on the outcome, even if people making those decisions at the time didn’t really anticipate their severity. It seemed like projections and decisions were being made without really having a thorough risk assessments being done.
Then I started to think what kind of risk assessments would help in the decision and design process. Since I have been trying to formulate methods and concepts for software project risk management, I now began to construct a more formal framework for how we could better approach something as abstract as managing complex engineering project risks. Few key principles central to this kind of approach immediately emerged:
a) For one, risk assessments need to be done. Even if they are usually not very accurate because of the unknown factors inherent to engineering projects, they have the benefit of forcing both engineers and decision makers to think about what could go wrong.
b) Risk assessments benefit from scenario analysis, where several scenarios for the project are considered. Some of the scenarios incur irritating outcomes to budgeting like cost overruns, some are more like technological troubles which might affect project timeline etc. These kind of events are essentially known unknowns. We know that we don’t know everything when starting a new project, and we have to include some slack both in the budget and timeline. This is the easy part of scenario analysis.
c) Risk assessment needs to be done in a way to include a section that details plan B (or C, D, whatever letter it would be) in case some scenario turns out to be impossible. There are unknown unknowns, events that we are not able to anticipate even with careful analysis. By the nature of this unexpectedness, these events have the potential to jeopardise the whole thing. We don’t know what we don’t know. What if something totally unexpected happens so that we have to abandon the whole thing? Do we have a plan B? Moreover, we need description of these plans and what they mean resource wise. How much cost do they add to the plan A? How much more time is needed?
A risk management tool to anticipate the unanticipated
Even if we don’t know what we don’t know, we would still benefit greatly from a tool or method that could account for these unknowns. Turns out that there is such a tool in probability theory called a tree diagram, which can be used to represent all the possible ways the future might unfold. We can apply such a diagram to represent the probabilities of different sub-projects in a complex engineering project. It even turns out the same tool can be applied to accommodate for decisions made in a project, thus giving us a way to study the effects of decisions to the final project outcome probability before those decisions are made. Truly a tool to forecast the future!
Now we can apply this kind of tool to create a scenario analysis for both automation and Länsimetro projects described above. Scenario analysis includes 1) estimating probabilities of individual events, 2) calculating total scenario probabilities by multiplying event probabilities included in each scenario and 3) finally estimating the probability of how likely we think we are able to achieve our chosen target metric, or metrics. Target metrics are usually cost, time, or some project specific metric.
Case Länsimetro
Suppose that you are a decision maker responsible for making key decisions in Länsimetro project. City planners have given you forecasts, which show that in 2030 metro usage is projected to approach 25000 passengers / hour in peak hours (totally made up number like everything else in this analysis).
You also have a tool to aid you in decision making process: scenario analysis tool, which is able to calculate probabilities for achieving a selected metrics. In Case Länsimetro, metro capacity would be a likely candidate for that target metric. We are interested about how likely we are going to achieve some capacity level. Metro capacity can be expressed as maximum passengers per hour. We want to achieve a capacity of at least 30000 passengers per hour to have room for surprises and account for forecast inaccuracies.
Analysis calculation
Picture 1. shows outcome of this kind of scenario analysis. Scenario analysis tool is given a) probabilities for different events in metro project construction and operation, b) key metro configuration decisions and c) estimated target metric valuations calculated according to some formula for individual scenarios. Based on these, scenario analysis tool is able to calculate probability tree and most likely outcome for target metrics.
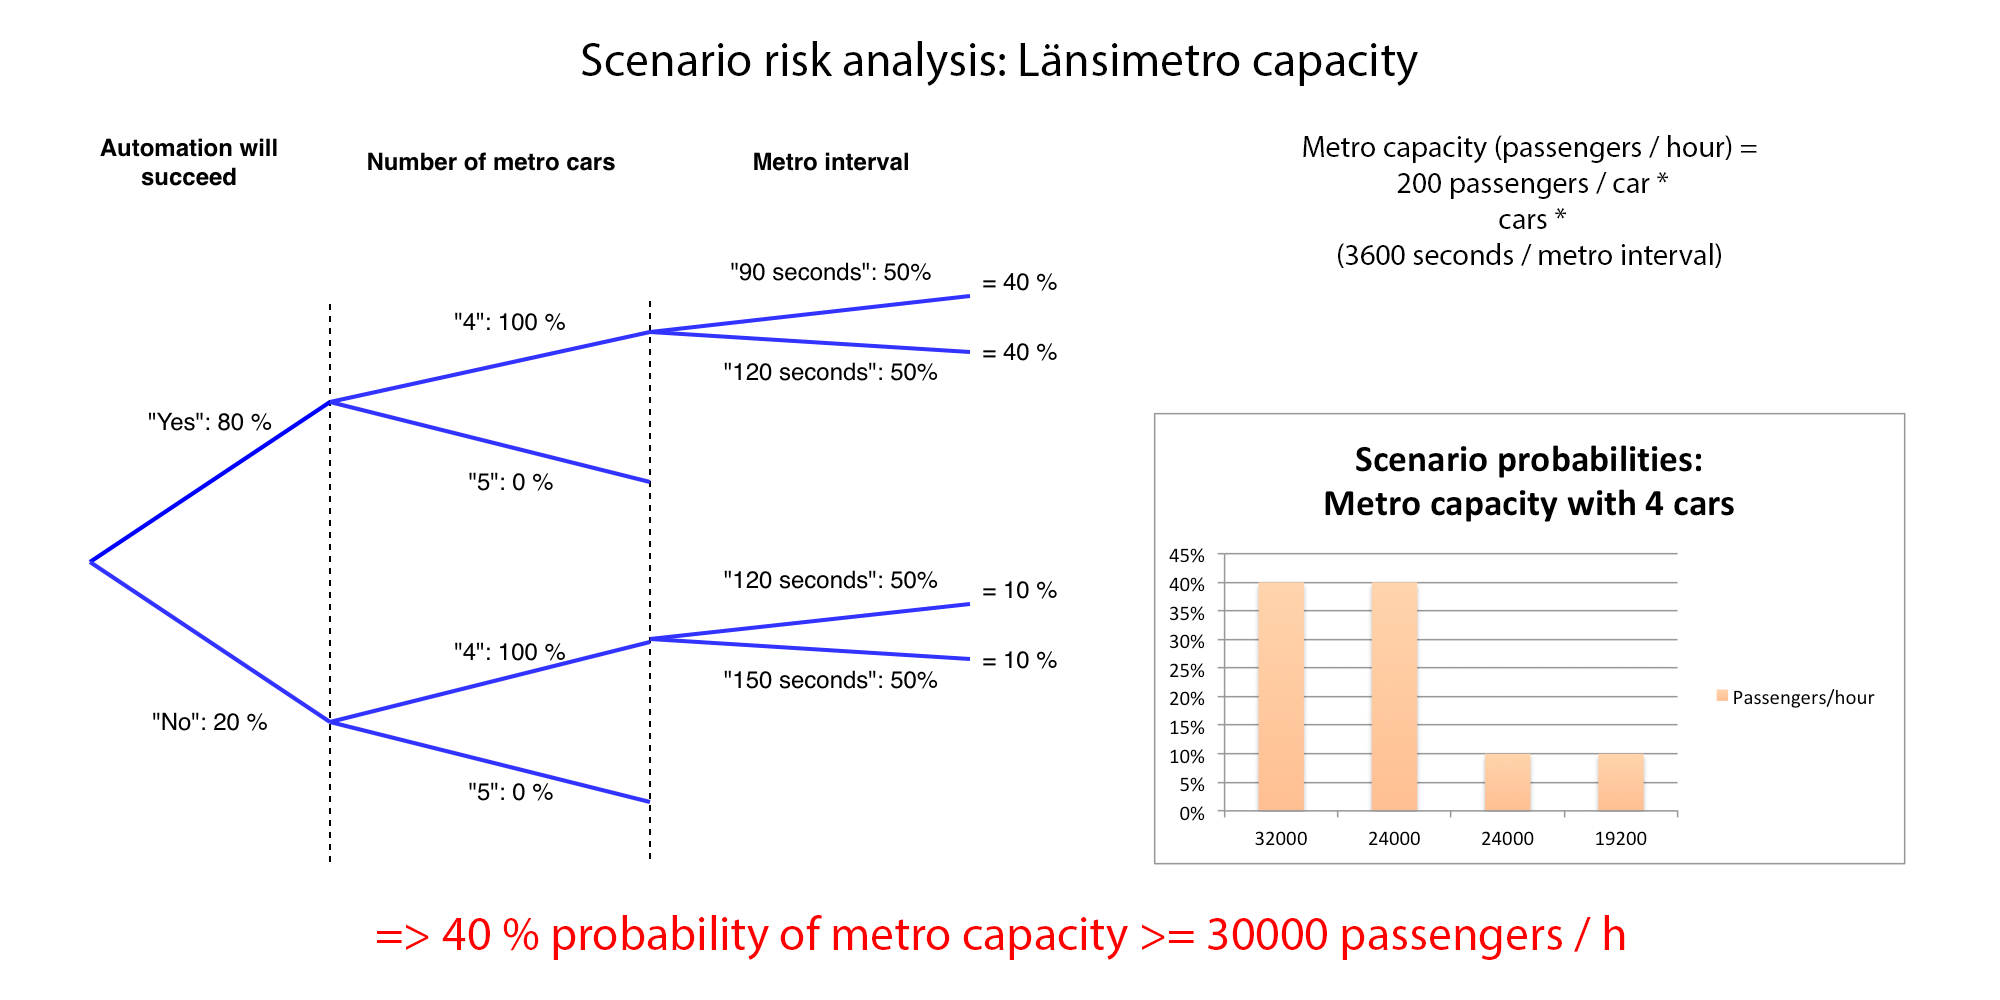
Here, probability tree includes probability for an event “Automation succeeds”. This is a key probability for our analysis: although automation project being a success is given a fairly strong probability, here 80 %, we have to account for unexpected events which cause the automation project to fail (OMG!), and represent them with a (rough) probability of 20 %.
Then we assign probability for outcomes of “Number of metro cars”, which is actually a decision, not an event. It is included in the probability tree to illustrate the way probability calculation can be fitted to be a tool for decision making analysis. While doing probability analysis we can change the amount of metro cars by switching the 100 % probability to some other choice, and get an instant update for eventual target metrics probability which we have chosen to be passengers / hour.
Third probability is given for range of outcomes of being able to operate metro with certain train intervals. Here we have different intervals for different scenarios: 90 and 120 seconds are being given equal probability (50 %) of being maximum interval in scenarios where automation succeeds. If metro automation does not succeed, we anticipate being able to operate metro in 120 or 150 second intervals, because of higher amount of manual labour (driver) needed.
Finally we get an aggregate probability for different scenarios by multiplying the probabilities of individual event outcomes. 40 % probability for both interval scenarios where automation succeeds, and 10 % probability where they don’t succeed.
Analysing the results
Final step of the analysis is to combine calculated target metrics for different scenarios with calculated scenario probabilities. Picture 1. shows a fairly crude formula for calculating metro capacity, presuming each metro car has space for 200 people. We can calculate metro capacity for each scenario and plot these with calculated probabilities on a probability-capacity graph. Picture 1. shows that according to our analysis we have a 40 % probability (the best case scenario where automation succeeds and train interval can be shrunk to 90 seconds) to achieve the target capacity for Länsimetro, which was chosen as 30000 passengers / hour.
Oh no! 40 % probability to achieve our target capacity is hardly enough for any responsible decision maker. This means we have to adjust our model parameters and see how we could end up with better odds.
There’s a single parameter in our model, and that is the number of cars in the train. We now adjust this parameter by raising it to five and see what happens.
Picture 2. shows the result for this kind of analysis. Everything else stays the same, but we adjust “Number of metro cars” outcome “5” to 100 % probability and “4” to 0 % probability. Now the updated analysis shows that passengers / hour metric equals or exceeds 30000 in two scenarios with probability of 40 % each, giving us total 80 % probability of achieving target metro capacity.
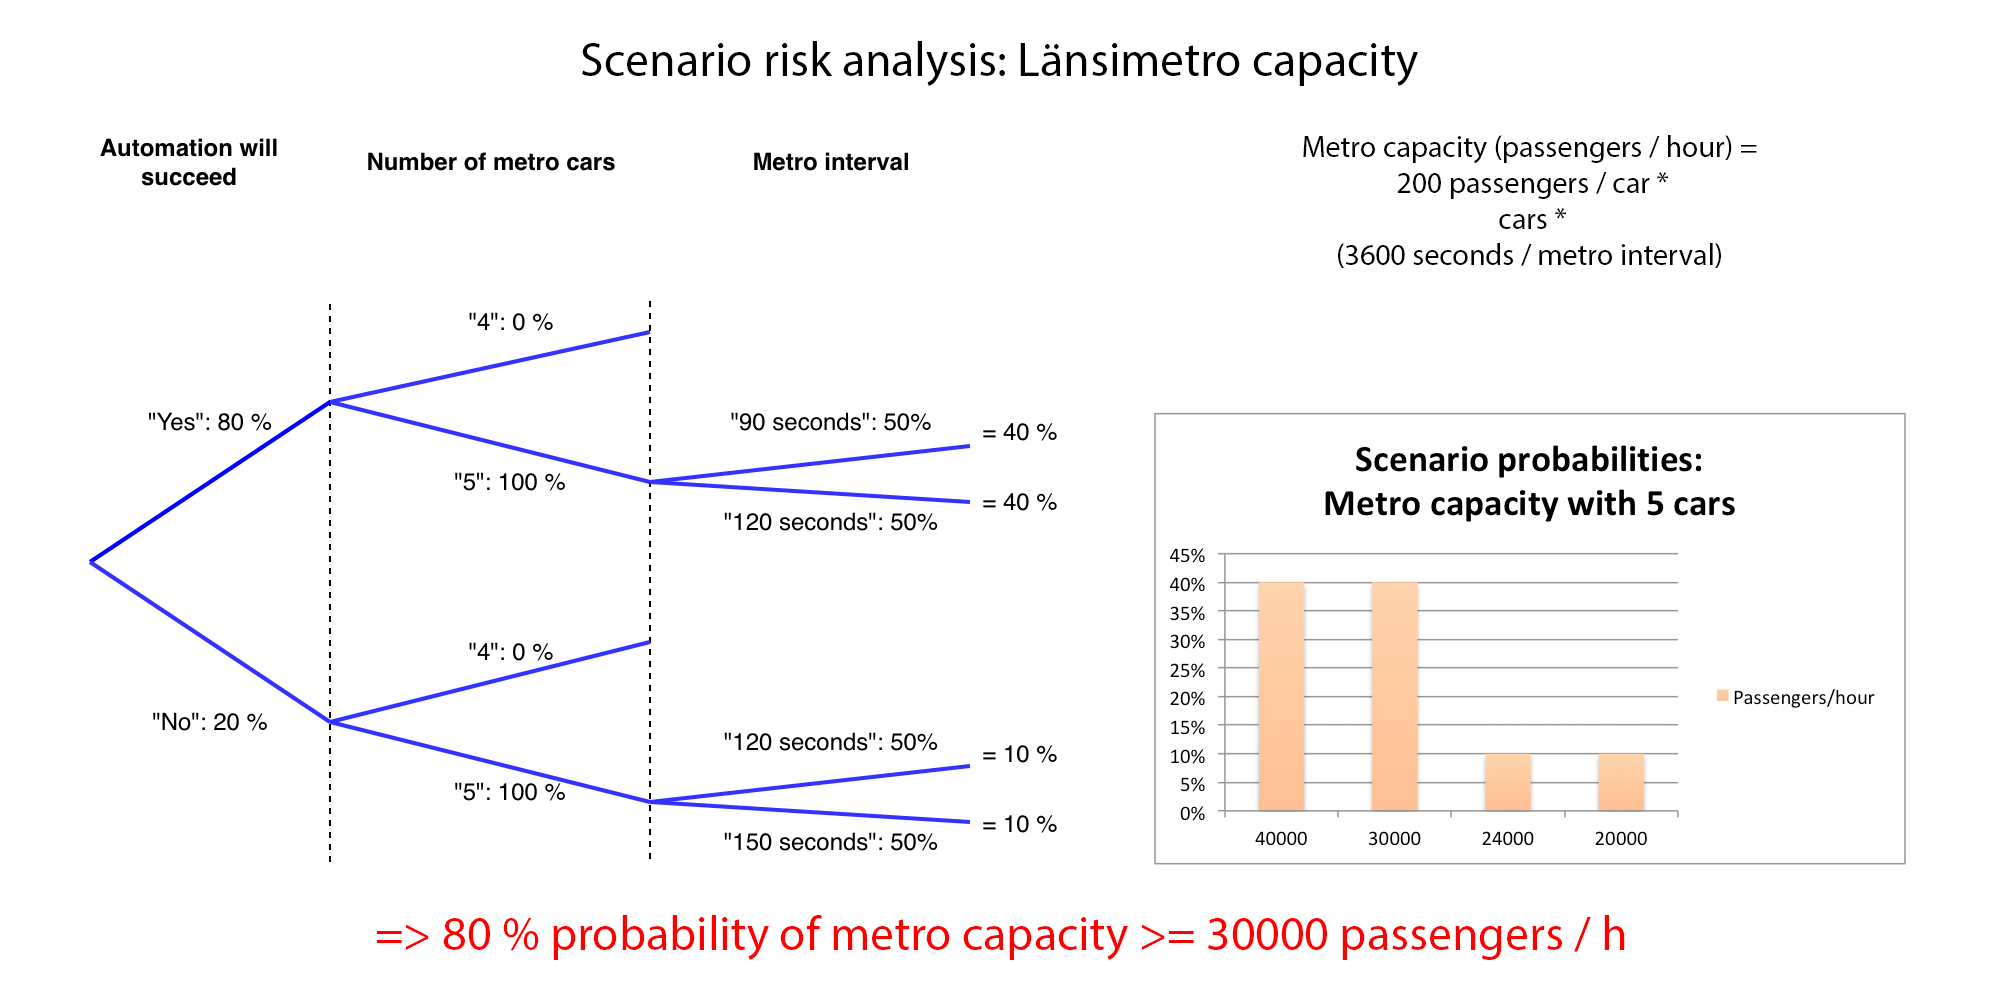
80 % probability, though being twice as high as 40 %, might not be enough for a responsible decision maker, who would most likely want to see something like 90-95% probability to be fairly certain of project success. With this kind of analysis we now however have a tool for being able to get to our target probability of success by refining the model and working with parameters.
Sources
- Espoon kaupungin kaupunginhallitus, pöytäkirja 27.04.2015. https://web.archive.org/web/20160304115912/http://espoo04.hosting.documenta.fi/kokous/2015332788-14.PDF. Haettu 04.03.2016.
- Kivekäs, Otso: Helsingin automaattimetro 1974 – 2014. https://web.archive.org/web/20170310144436/http://otsokivekas.fi/2014/12/helsingin-automaattimetro-1974-2014/. Haettu 10.03.2017.
- Tekniikka & Talous: Voisiko Espoon 90-metrisiä metroasemia pidentää jälkikäteen 135 metriin? - Näin vastaa asiantuntija. https://www.tekniikkatalous.fi/tekniikka/rakennus/voisiko-espoon-90-metrisia-metroasemia-pidentaa-jalkikateen-135-metriin-nain-vastaa-asiantuntija-6742892. Haettu 21.10.2018.
- Helsingin Uutiset: Shokkiraportti: Länsimetro tukkeutuu jo reilussa 5 vuodessa – “Käsittämätöntä ja pöyristyttävää”. https://www.helsinginuutiset.fi/artikkeli/707290-shokkiraportti-lansimetro-tukkeutuu-jo-reilussa-5-vuodessa-kasittamatonta-ja. Haettu 21.10.2018.
- Kuvituskuva “Tapiola metro station”, ottanut Markus Säynevirta. https://www.flickr.com/photos/msaynevirta/38596464066/. Haettu 21.10.2018.