TL;DR; This project describes a prototype for engineering project risk analyser, project outcome prediction and risk management software. Prototype is online (for the time being) at https://tikkasoftware.com/riskcalculator/.
In my last blog post I studied engineering project risk management with a specific case study. I also introduced a way to calculate overall project success probability, which I applied to the case study to point out how that approach would have helped the designers and planners of Länsimetro project.
Recently I’ve been working on a prototype software, which would automate the calculation of project success probability by method described above. The software is designed to help build and maintain engineering project models, which can be updated along with the project. Models consist of scenarios, which describe a series of events that take place during project. Those scenarios in aggregate form a tree of all the possible paths for the project. Individual scenarios or paths can then be assigned an overall probability, work estimate and also custom estimates of metrics, which are all used to predict overall project success probability.
The software is meant to help both project planners and also stake holders to have an up to date view of the project progress, and overall risks. It’s not natural for engineers or designers to admit that they don’t know everything, and that their carefully constructed plans contain hidden risks. It is my firm belief that by using this kind of tool ultimately helps to plan and anticipate expected and unexpected risks during project lifecycle. It is certainly no use to try to hide the risks and try to convince project stake holders that things are fully under control, when in reality those risks are not in total control. Instead, those need to be acknowledged and communicated to everyone.
An example of a civil engineering project plan
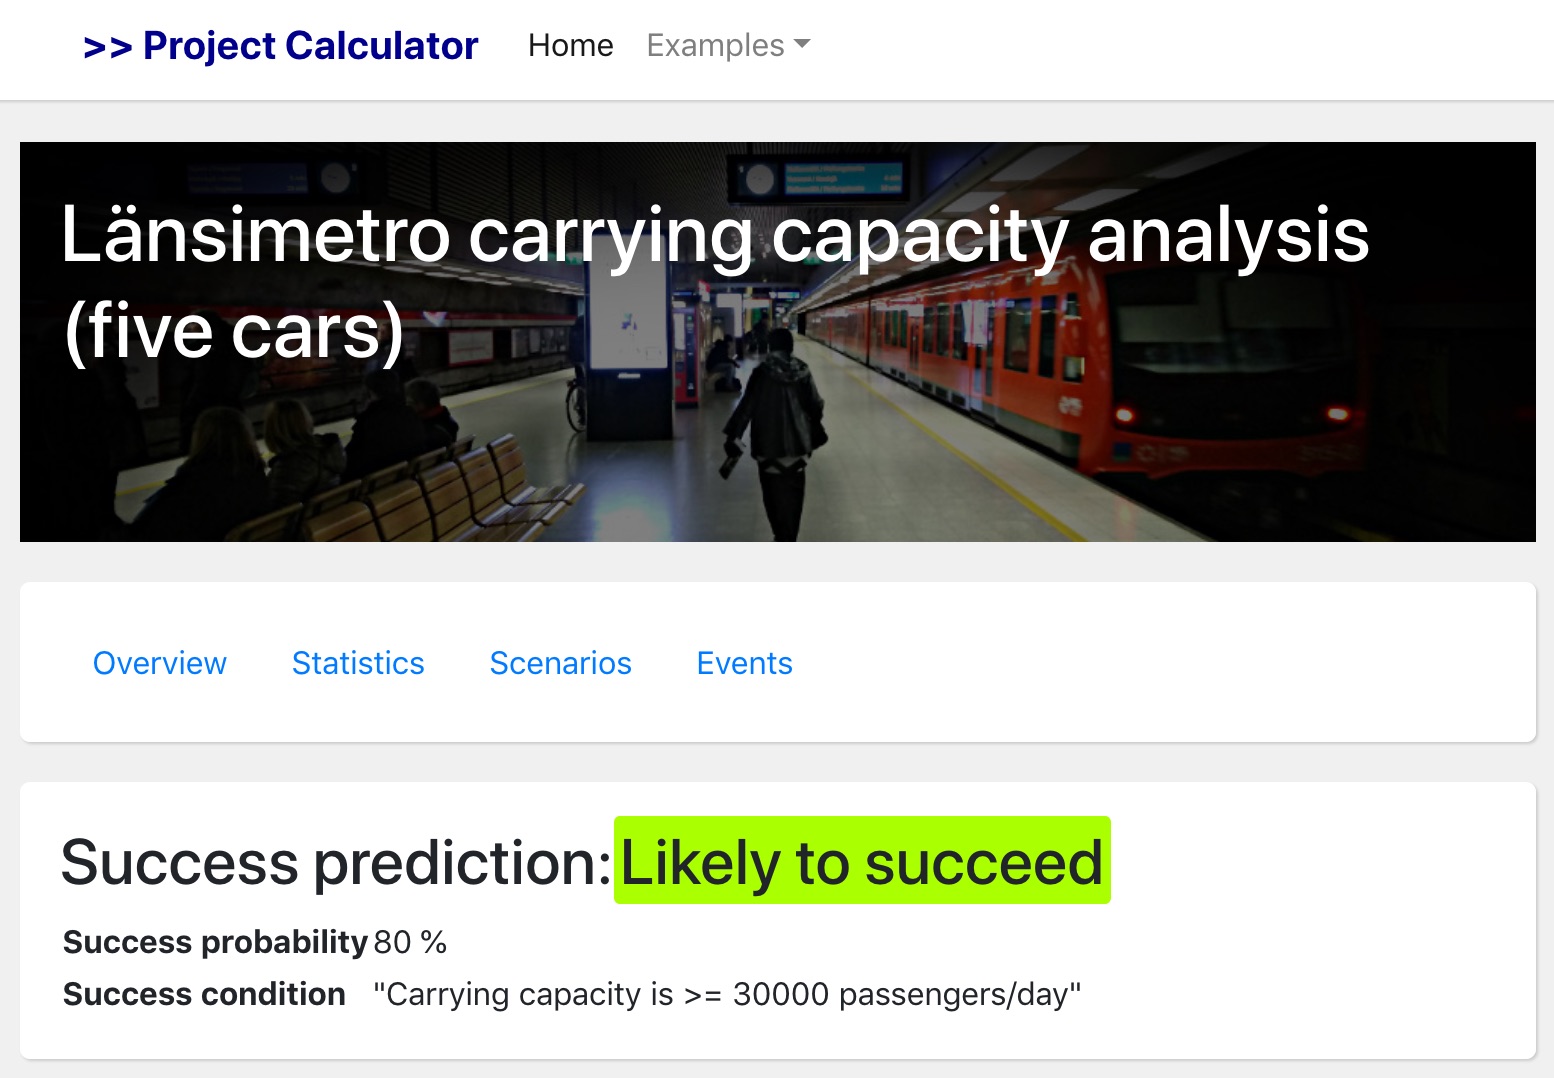
Project risk analyser website also includes a few examples. One example is the Länsimetro Case study, which I wrote about in my previous blog post. The case study focuses on a custom metrics of passengers/hour for a metro extension line. While creating a project plan, custom metrics can be assigned for each individual scenario, so that the chosen custom metric can be utilised on probability calculations. Naturally, custom metrics calculations need to be done outside of project tool.
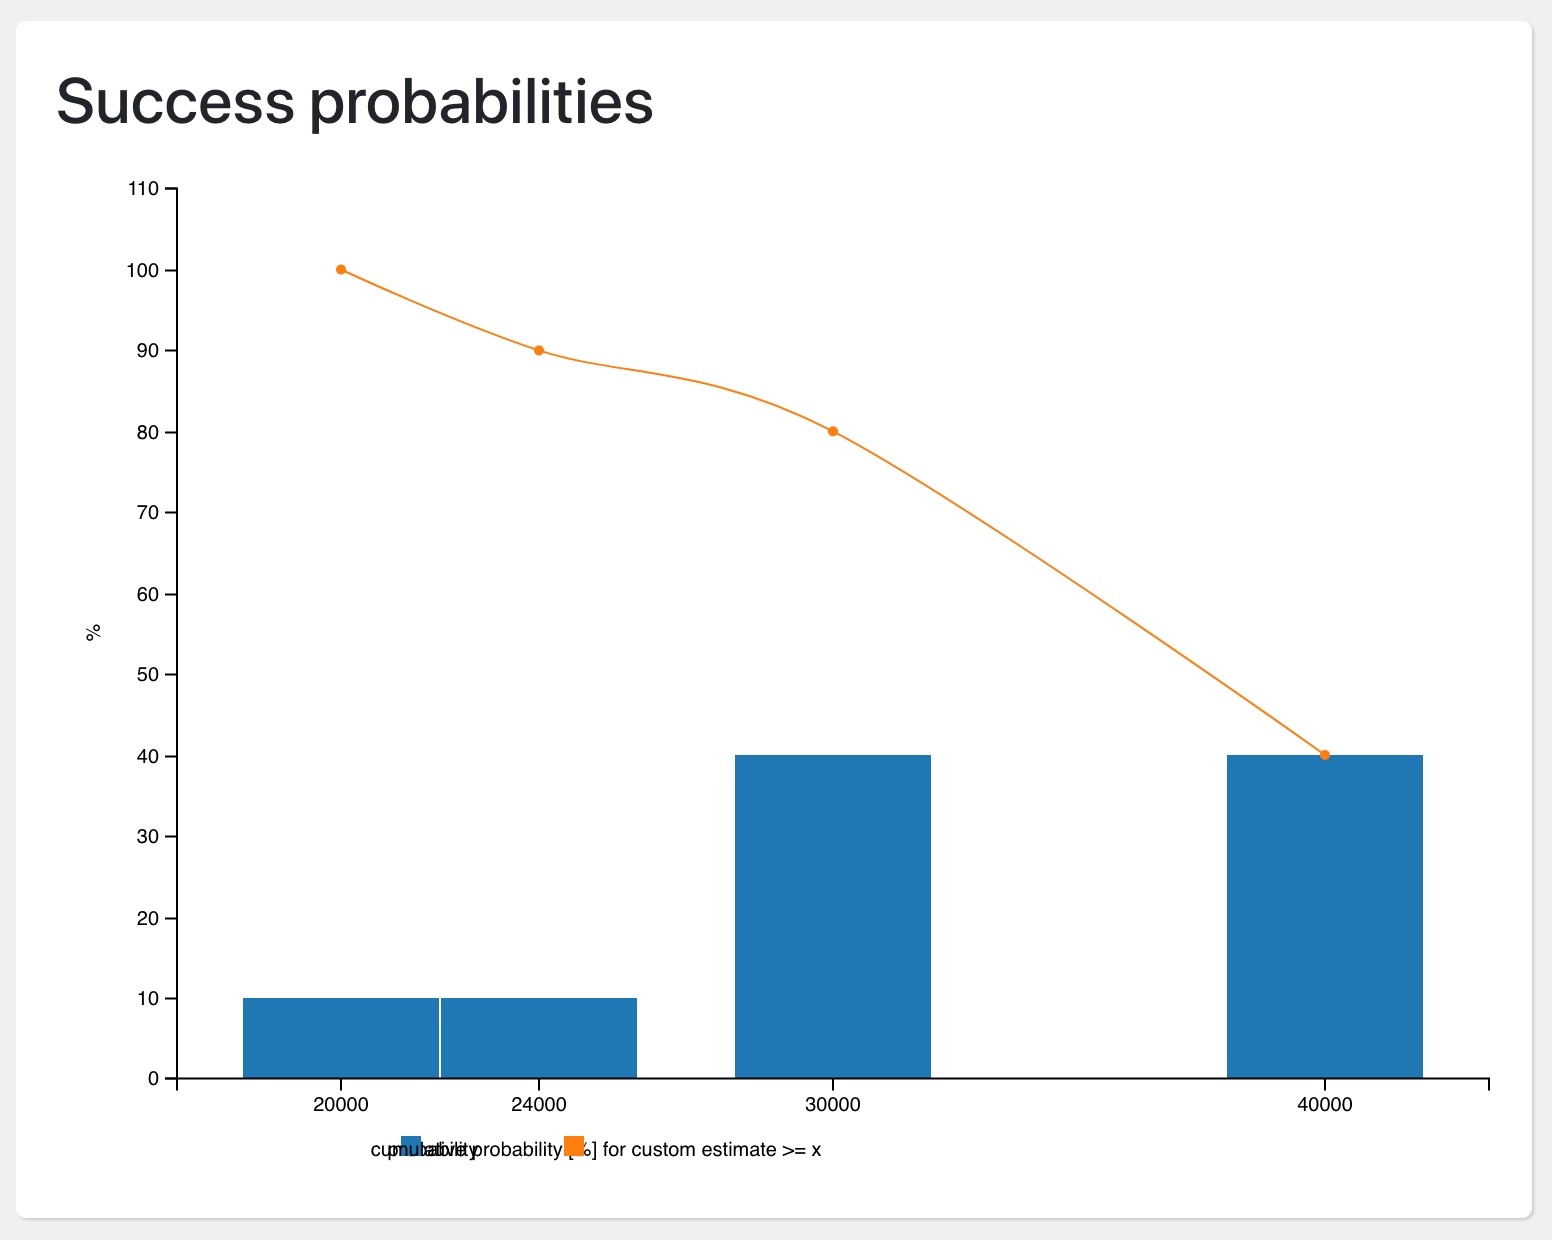
Project page includes success probability calculation as per custom metrics, plotted on a bar graph. Graph also includes cumulative probability as line graph, which is calculated as a sum of outcome probabilities that achieve a particular custom metric value. Graph above shows that probability for achieving a particular value of passengers/hour decreases from being 100 % with 19200 passengers/h to 40 % with 40000 passengers/h.
An example of a software project plan
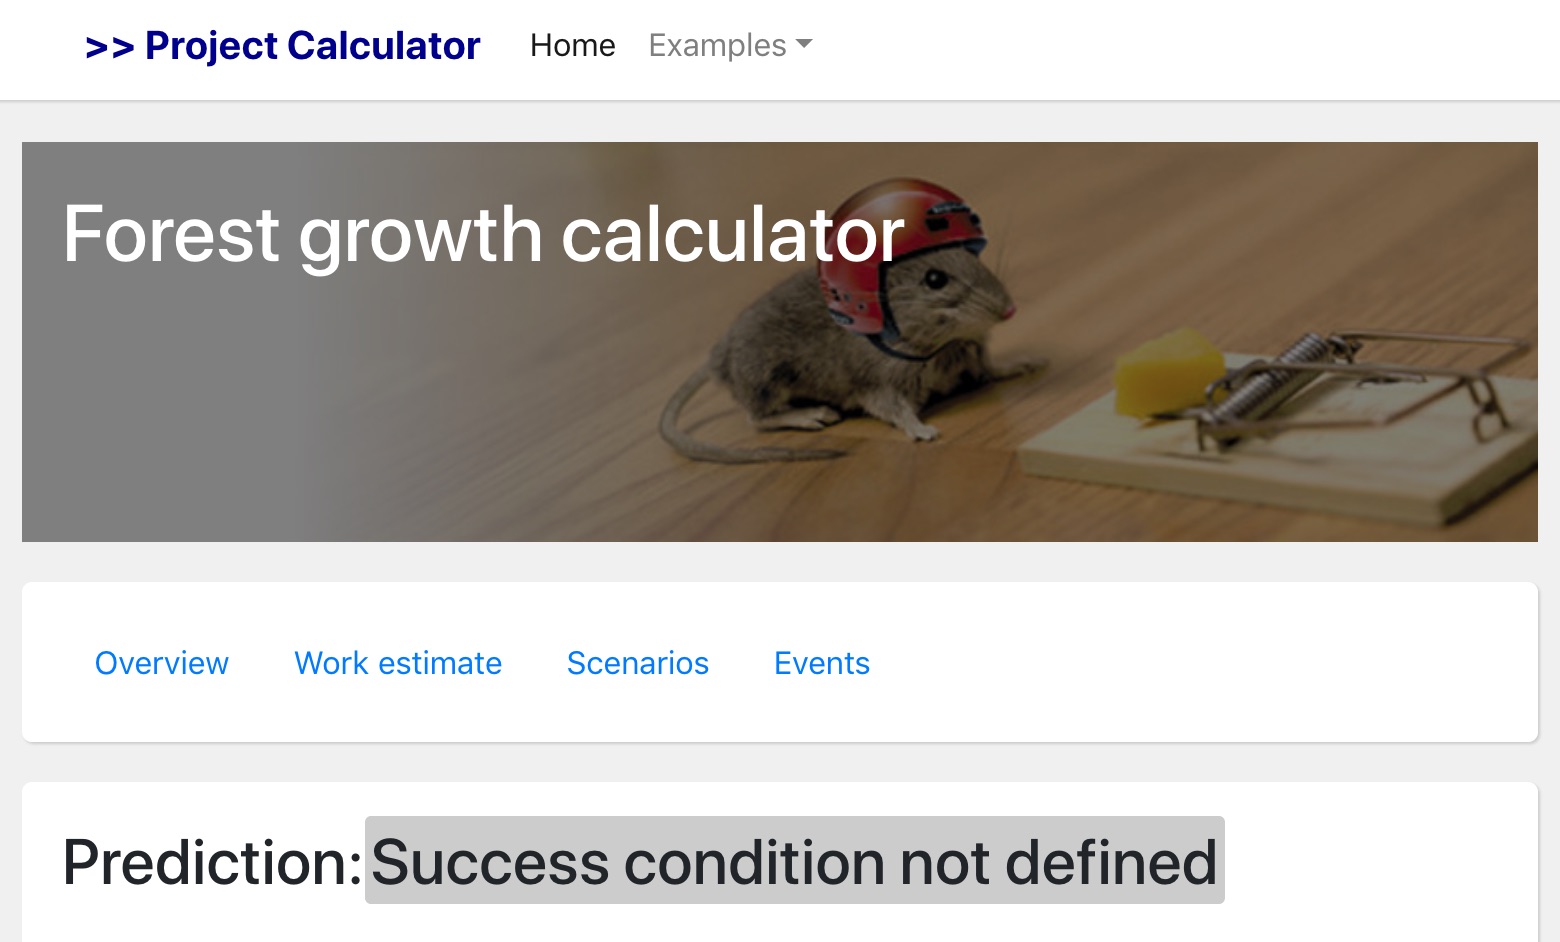
Second example is a software project, which tracks work estimates for individual events. “Events” in this project are software components and integrations. Each event is estimated for how much work it requires and also how likely it is that it will be completed “successfully” (success definition is given as percentage and given by user). Some software components are usually very likely to succeed and so their “event” can be defined as having a single probable outcome (success with 100 % probability), but work required to complete them is usually less known. On the other hand, some components (like integrations) have a bit higher chance of failure, so those probabilities are appropriately adjusted in the project model.
Note that this example does not include prediction for the overall software success. Success criteria is not required to be defined in a project plan. Success criteria can be set to define a threshold for an individual metric, and whether that threshold is exceeded or not defines whether project can be calculated to be a success. So this example lacks defined success criteria and project model is only used to track work estimate for the overall project.
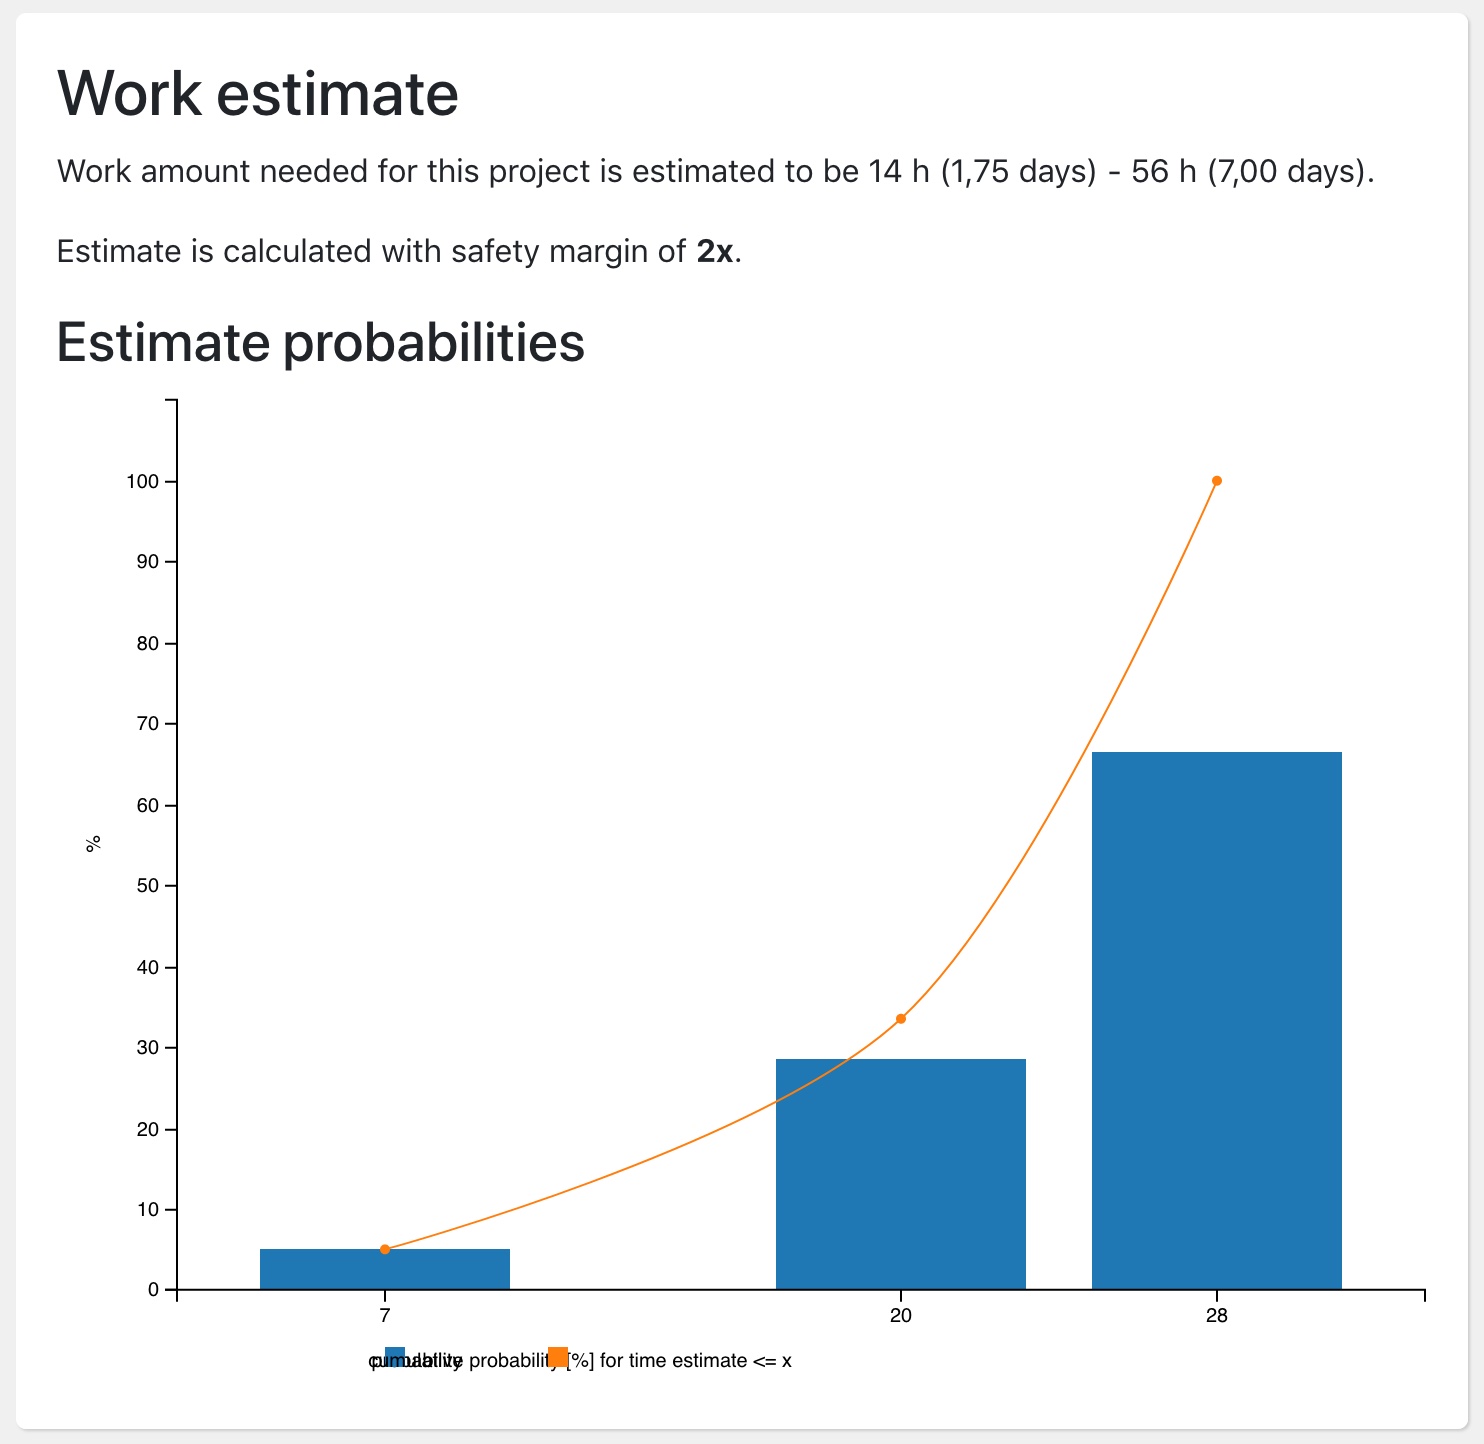
Work estimate section shows probabilities for calculated work amounts in a bar graph. This kind of bar graph should help project stake holders to get a feel for how likely project is to achieve it’s work amount targets and therefore overall cost targets. Graph above shows that probability of total project work being under a particular value increases, so that probability for project work being <= 7 hours is only 5 %, but work amount being under or equalling 28 hours is 100 %.
Project risk analyser FTW
This prototype demonstrates the validity of this type of approach for calculating project success probability with the help of a probability tree diagram. I anticipate that quantifying engineering project as a set of future scenarios with varying probabilities would be a useful approach for many kinds of engineering disciplines and so this tool would useful in wide variety of engineering projects. I hope to be able to test this tool with some real life projects in the future in order further validate it’s usefulness in various work scenarios.